
EcoFlow RIVER 3 USB-C 100W Tested: Output, Runtime and Cable Lessons (2026 Guide)
In-depth review — We tested the EcoFlow RIVER 3 USB-C port at 60W, 80W, 100W-class output, and a full discharge, including cable limits and the 216.8Wh re…
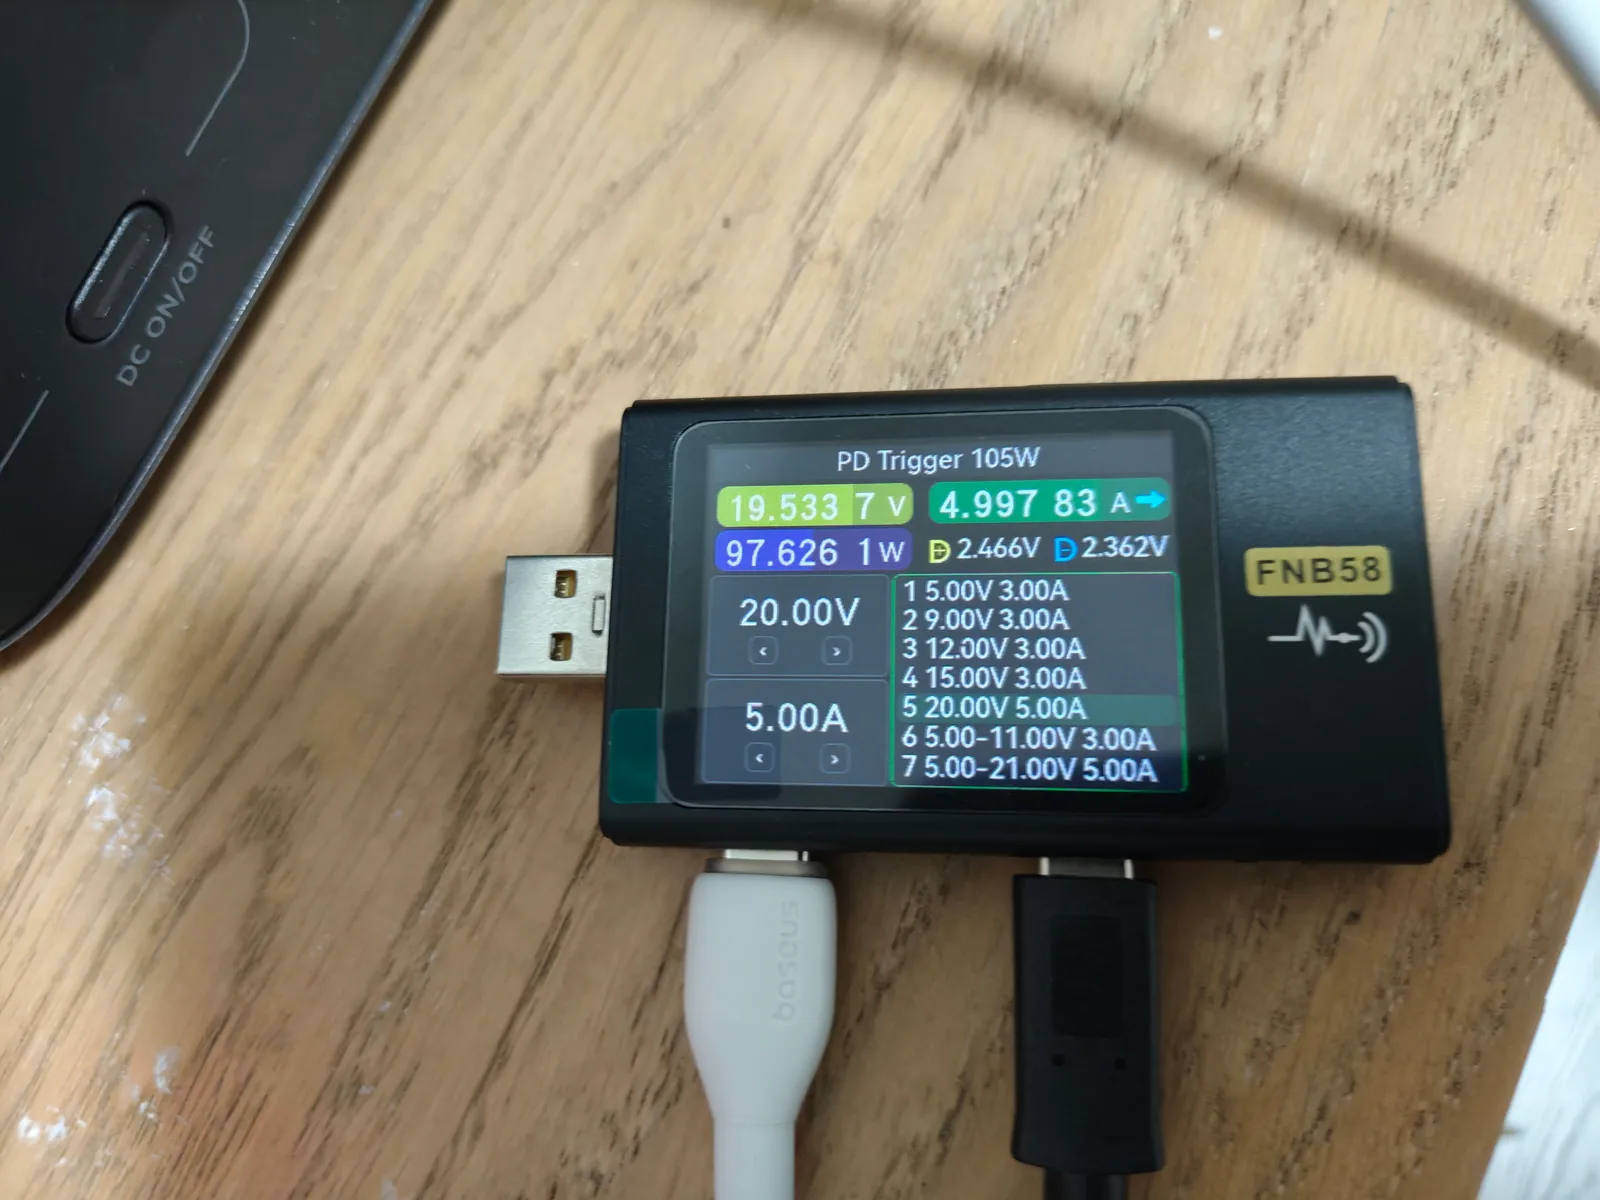
Short version: yes, our EcoFlow RIVER 3 delivered a real 100W-class USB-C output when we used a proper 5A E-Marker USB-C cable. The power meter exposed a fixed 20V/5A PDO, the port held about 97.62W to 97.68W at the FNB58 meter for 15 minutes, and a full 100W-class discharge produced an estimated 216.8Wh over USB-C before the station stopped output.
That does not mean every cable or test setup will show 100W. One of our USB-C cables only negotiated 20V/3A, which limited the setup to about 60W. We also saw a PD trigger/test-chain behavior where connecting a downstream cable caused the meter to pop a confirmation screen or fall back to 5V. The power station was not the weak link in that case; the USB-C chain was.
Want to calculate this for your exact setup? Use our Runtime Calculator — it accounts for real-world losses.
What we tested
This focused USB-C test came after our full EcoFlow RIVER 3 review. The goal was simple: verify whether the USB-C port can negotiate and sustain the 100W-class output that laptop and mini-PC users care about.
We tested four things:
- Whether a 5A cable exposes a 20V/5A PD profile.
- Whether the port stays stable at 60W, 80W, and 100W-class loads.
- How much usable energy comes out of USB-C from full to shutdown.
- Why some cables or meter chains only reach 60W or fall back to 5V.
The tested unit was the same China-market 220V RIVER 3 used in our main review. It is not a RIVER 3 Plus; we explain the model-name issue separately in our RIVER 3 vs RIVER 3 Plus identification guide.
Test setup
Our USB-C load chain used:
- EcoFlow RIVER 3 at the USB-C output.
- A 5A E-Marker USB-C cable between the station and meter.
- FNB58 USB tester / PD trigger.
- UNI-T UTL8212+ electronic load.
- Thermal camera and sound meter.
The electronic load was run in constant-current mode, not constant-power mode. This matters. At a nominal 20V USB-C profile, setting 5.00A produces roughly 97W to 100W depending on real voltage and cable losses. Constant-current mode avoids a situation where the load tries to pull more than 5A just to force an exact 100.00W reading.
The room was about 29°C during the longer test series.
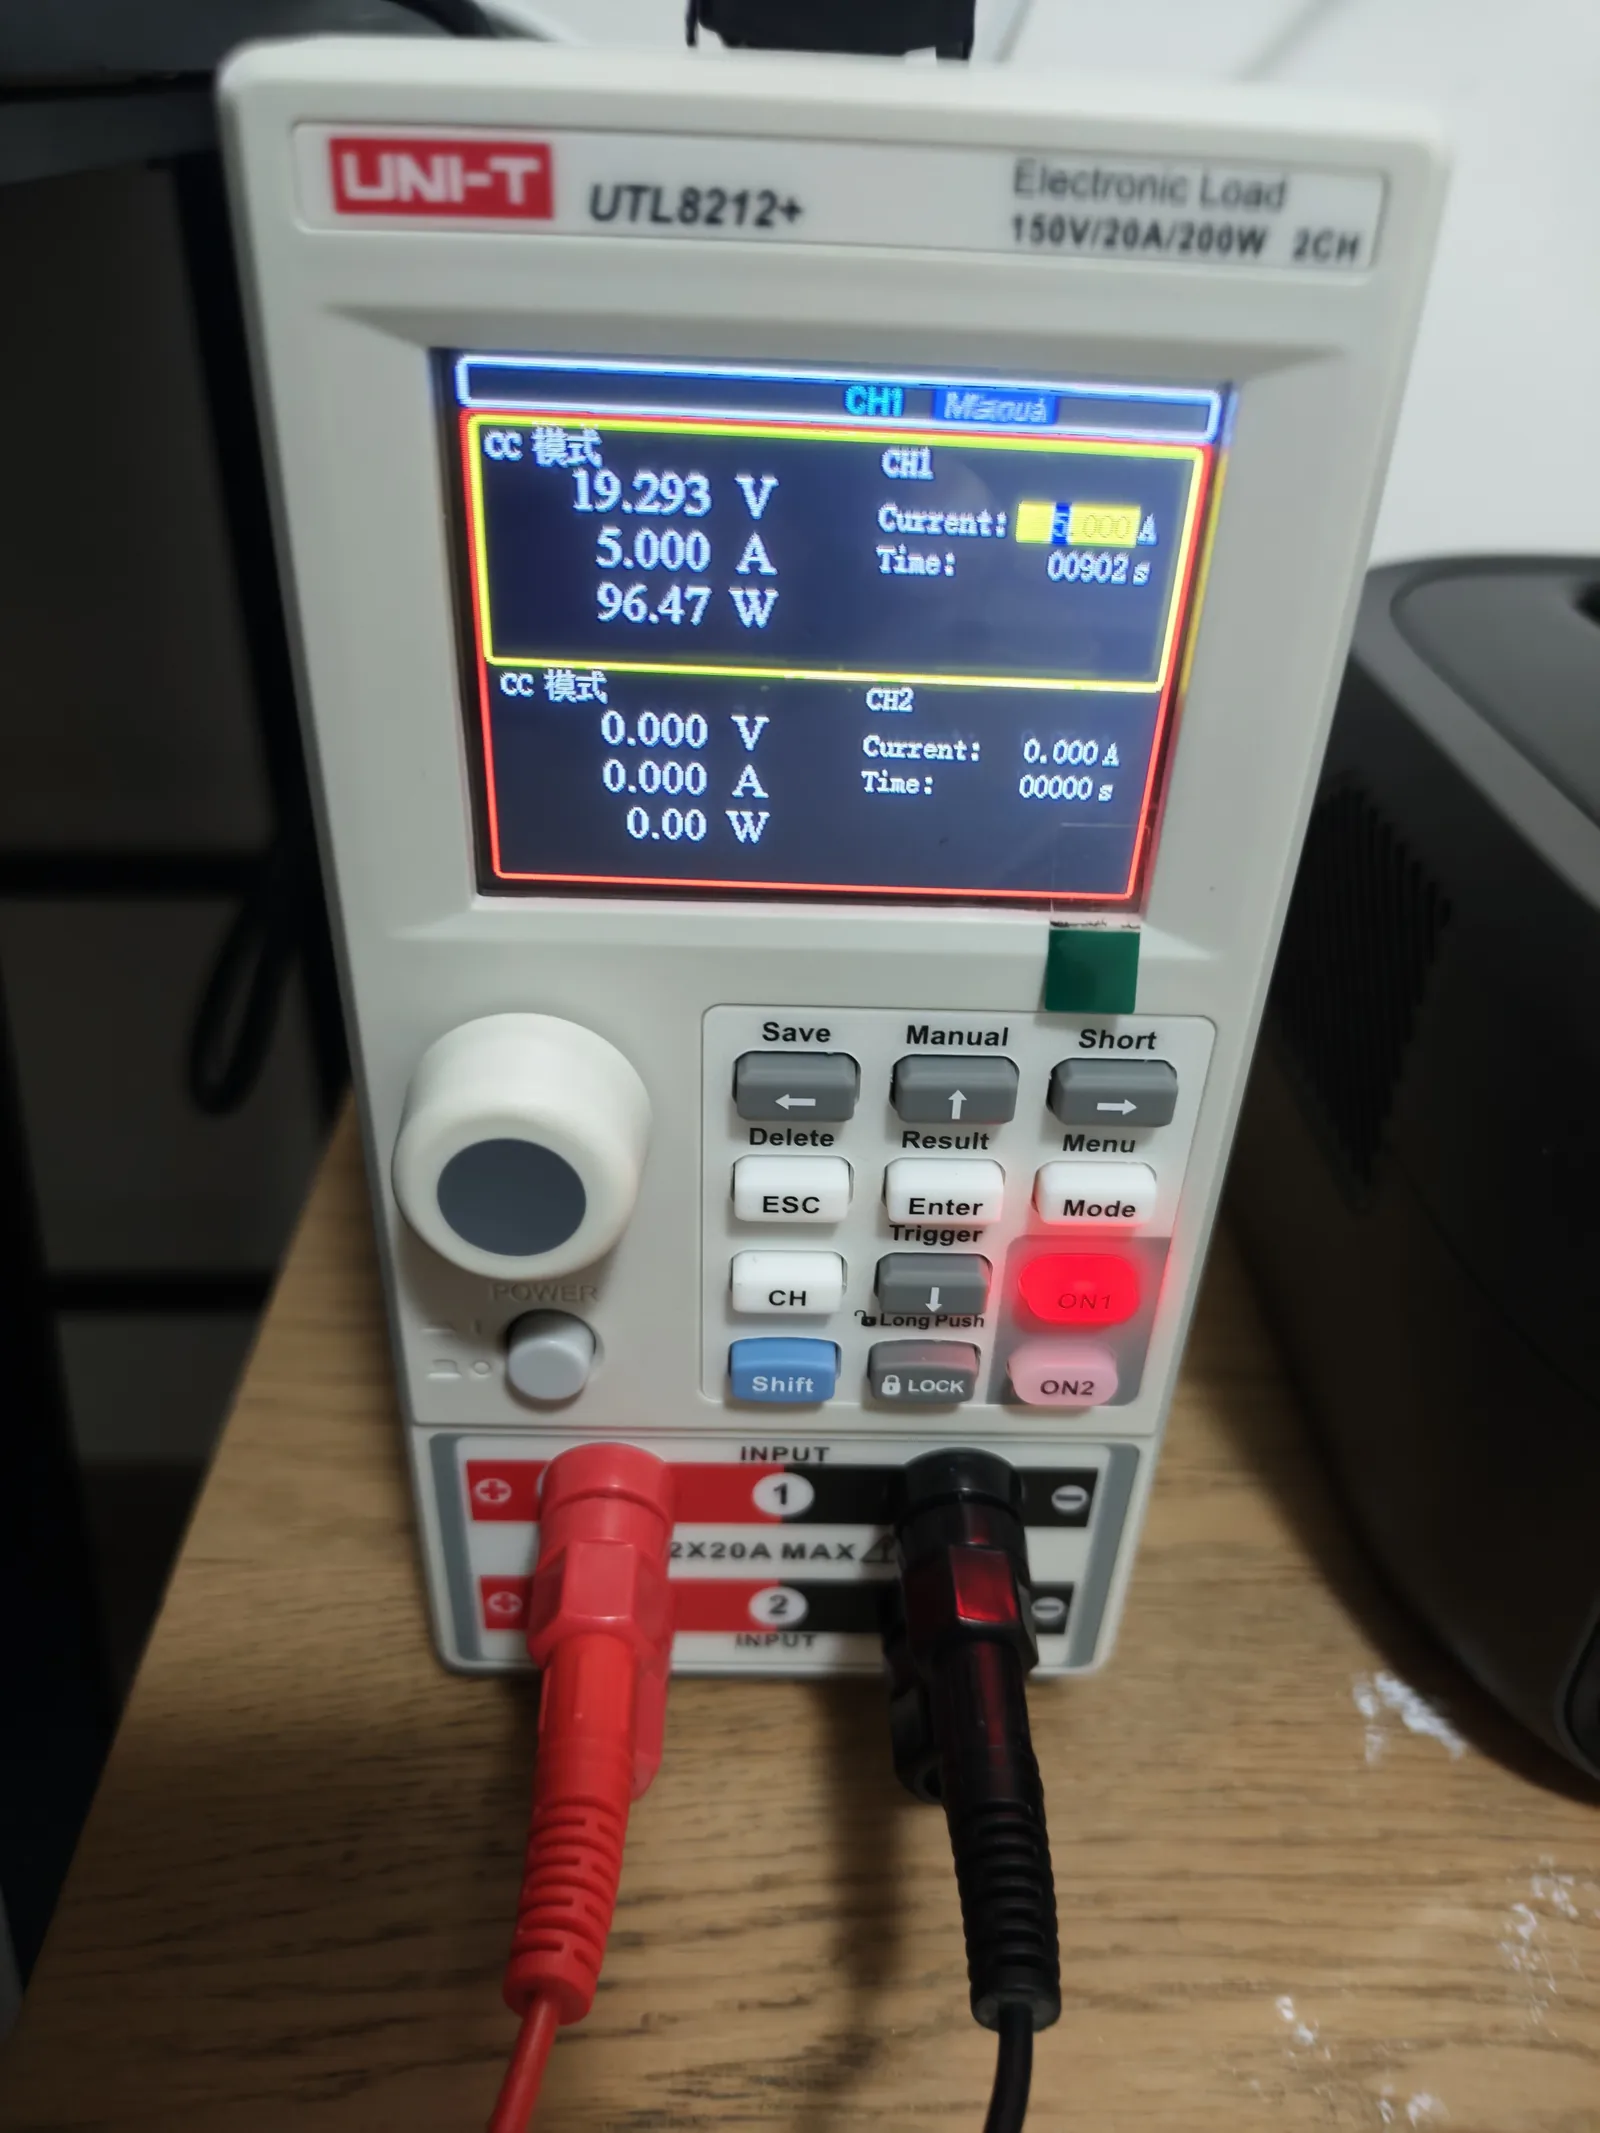
The load-side view of the 100W-class stage: our UNI-T UTL8212+ in constant-current mode at 5.000A read 19.293V / 96.47W — matching the load-side numbers in the table below.
PDO result: the port exposed 20V/5A
With the correct 5A E-Marker cable, the meter showed the expected 100W-class profile:
| PD profile observed | Result |
|---|---|
| Fixed 5V | 3A |
| Fixed 9V | 3A |
| Fixed 12V | 3A |
| Fixed 15V | 3A |
| Fixed 20V | 5A |
| PPS | Up to 21V / 5A |
That 20V/5A line is the important one. Without it, the setup cannot honestly test 100W USB-C output. With a different C-to-C cable, our test chain only exposed 20V/3A, so it was practically limited to about 60W.
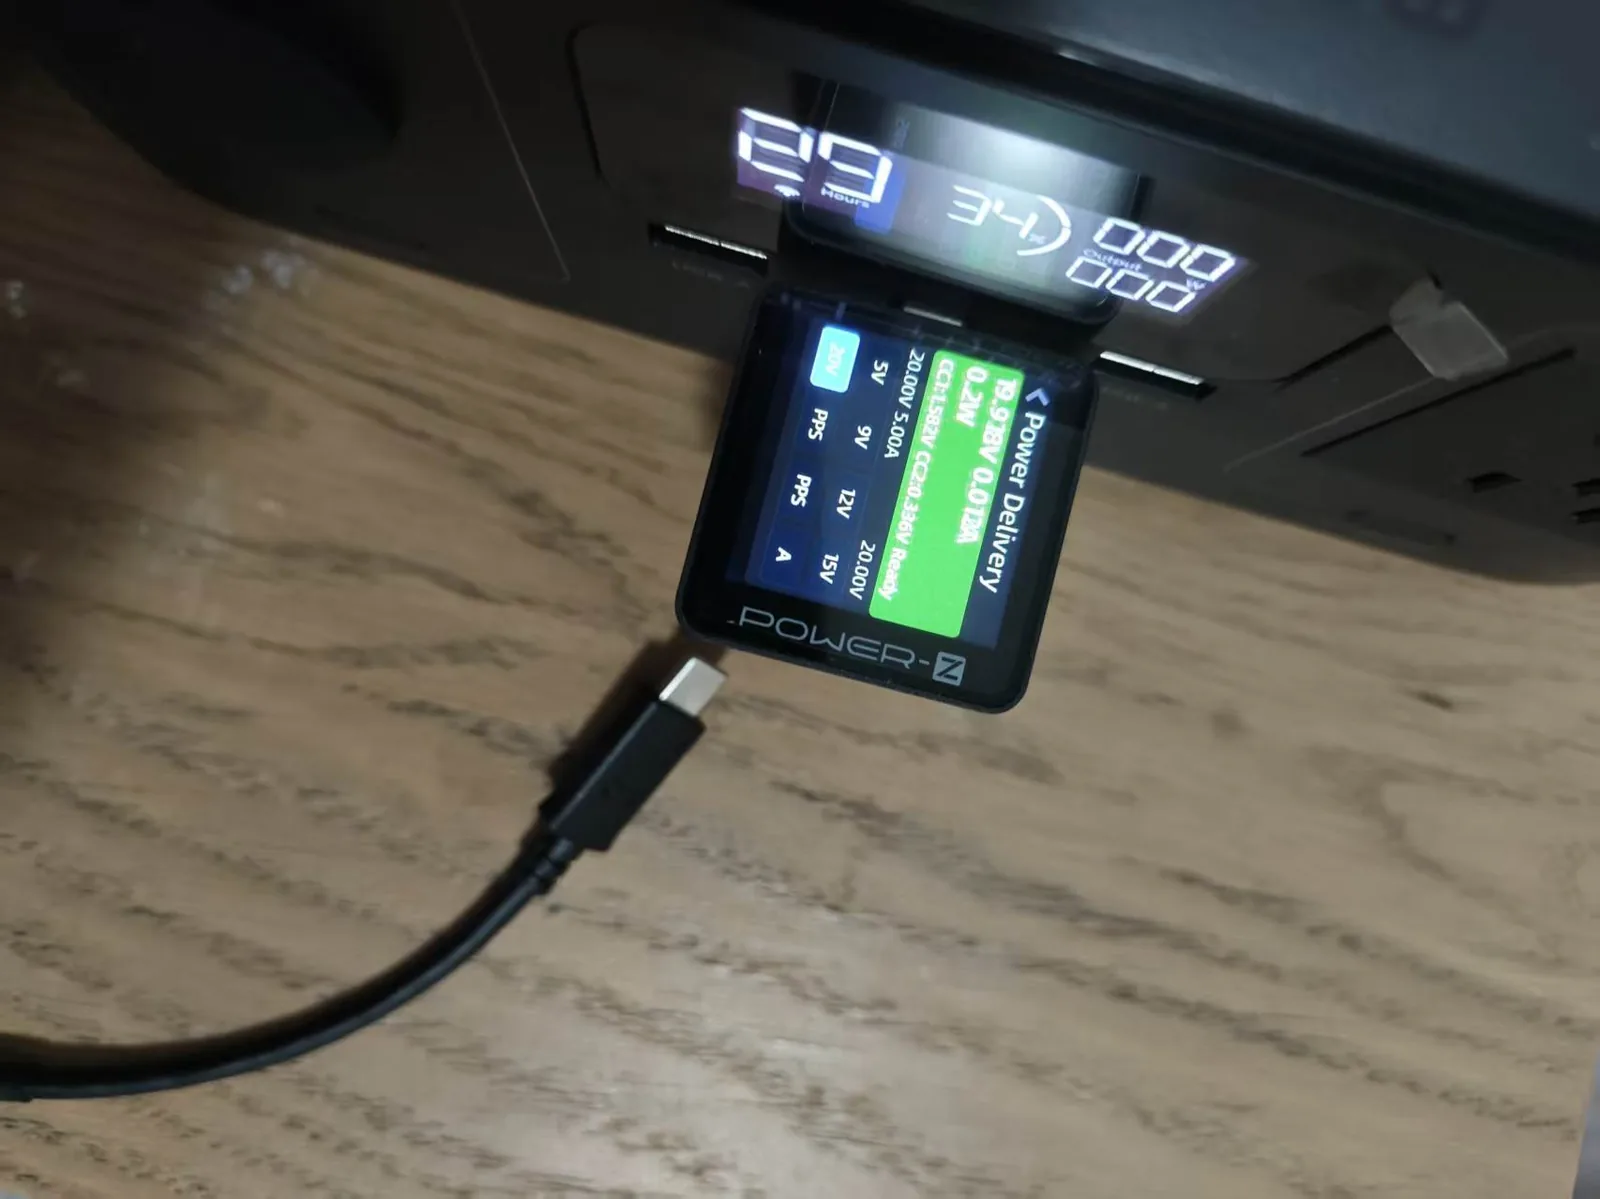
A Power-Z PD analyzer cross-check on the RIVER 3’s USB-C port: the fixed 20V/5A profile appears only with a 5A-capable cable in the chain.
With the right cable, the RIVER 3 held a 100W-class USB-C load. The meter showed about 97.6W because the actual voltage was slightly below 20V.
60W, 80W and 100W-class stability results
We stepped the load upward instead of jumping straight to 5A. That gave us a cleaner picture of voltage stability, heat, fan behavior, and cable loss.
| Stage | Load setting | Meter-side result | Load-side result | Runtime | Result |
|---|---|---|---|---|---|
| 60W check | 3.00A | 19.783-19.787V / about 59.4W | Not recorded for every point | 5 min | Stable, fan off |
| 80W check | 4.00A | 19.682-19.685V / about 78.8W | 19.492-19.503V / about 78.0W | 10 min | Stable, fan off |
| 100W-class check | 5.00A | 19.532-19.547V / 97.620-97.677W | 19.293-19.317V / 96.47-96.59W | 15 min | Stable, fan on |
At the highest stage, we did not see a shutdown, reboot, repeated renegotiation, or sustained derating. The station’s fan started, which is normal under a near-maximum USB-C load.
Why a 100W port may show 97W
This is the part that trips people up. A USB-C port rated for 100W does not have to show exactly 100.00W at the far end of a real test cable.
In our 100W-class stage, the meter saw about 19.53V and 4.997A:
19.53V × 4.997A ≈ 97.6WThe electronic load, which was farther downstream, saw about 96.5W because there was additional loss across the meter, adapters, and wiring. That is normal. The meaningful result is not the missing two or three watts; it is that the RIVER 3 exposed 20V/5A and held a near-5A load without instability.
If a laptop shows 85W or 92W for a few moments, that can also be normal. Laptops negotiate power dynamically and may taper based on battery level, temperature, firmware, and their own charging policy. A fixed electronic load is a better way to test the port’s ceiling.
Full USB-C discharge result: estimated 216.8Wh
For the full USB-C usable-capacity test, we charged the RIVER 3 to 100%, turned off AC and DC outputs, connected the USB-C load chain, and discharged at 5.00A until USB-C output stopped.
| Item | Result |
|---|---|
| Start | About 13:11 |
| Stop | About 15:26 |
| Runtime | About 135 minutes / 2.25 hours |
| Load-side power range | About 96.31W to 96.55W |
| Estimated average power | About 96.36W |
| Estimated USB-C output energy | 216.8Wh |
| Nameplate battery capacity | 245.76Wh |
| Estimated usable ratio | 88.2% |
The calculation is:
96.36W × 2.25h = 216.8Wh
216.8Wh ÷ 245.76Wh = 88.2%
This is a power-times-runtime estimate. It is not a cumulative Wh reading from the FNB58. That distinction matters, so we would phrase the result as: at a continuous 100W-class USB-C load, our RIVER 3 delivered an estimated 216.8Wh before output stopped.
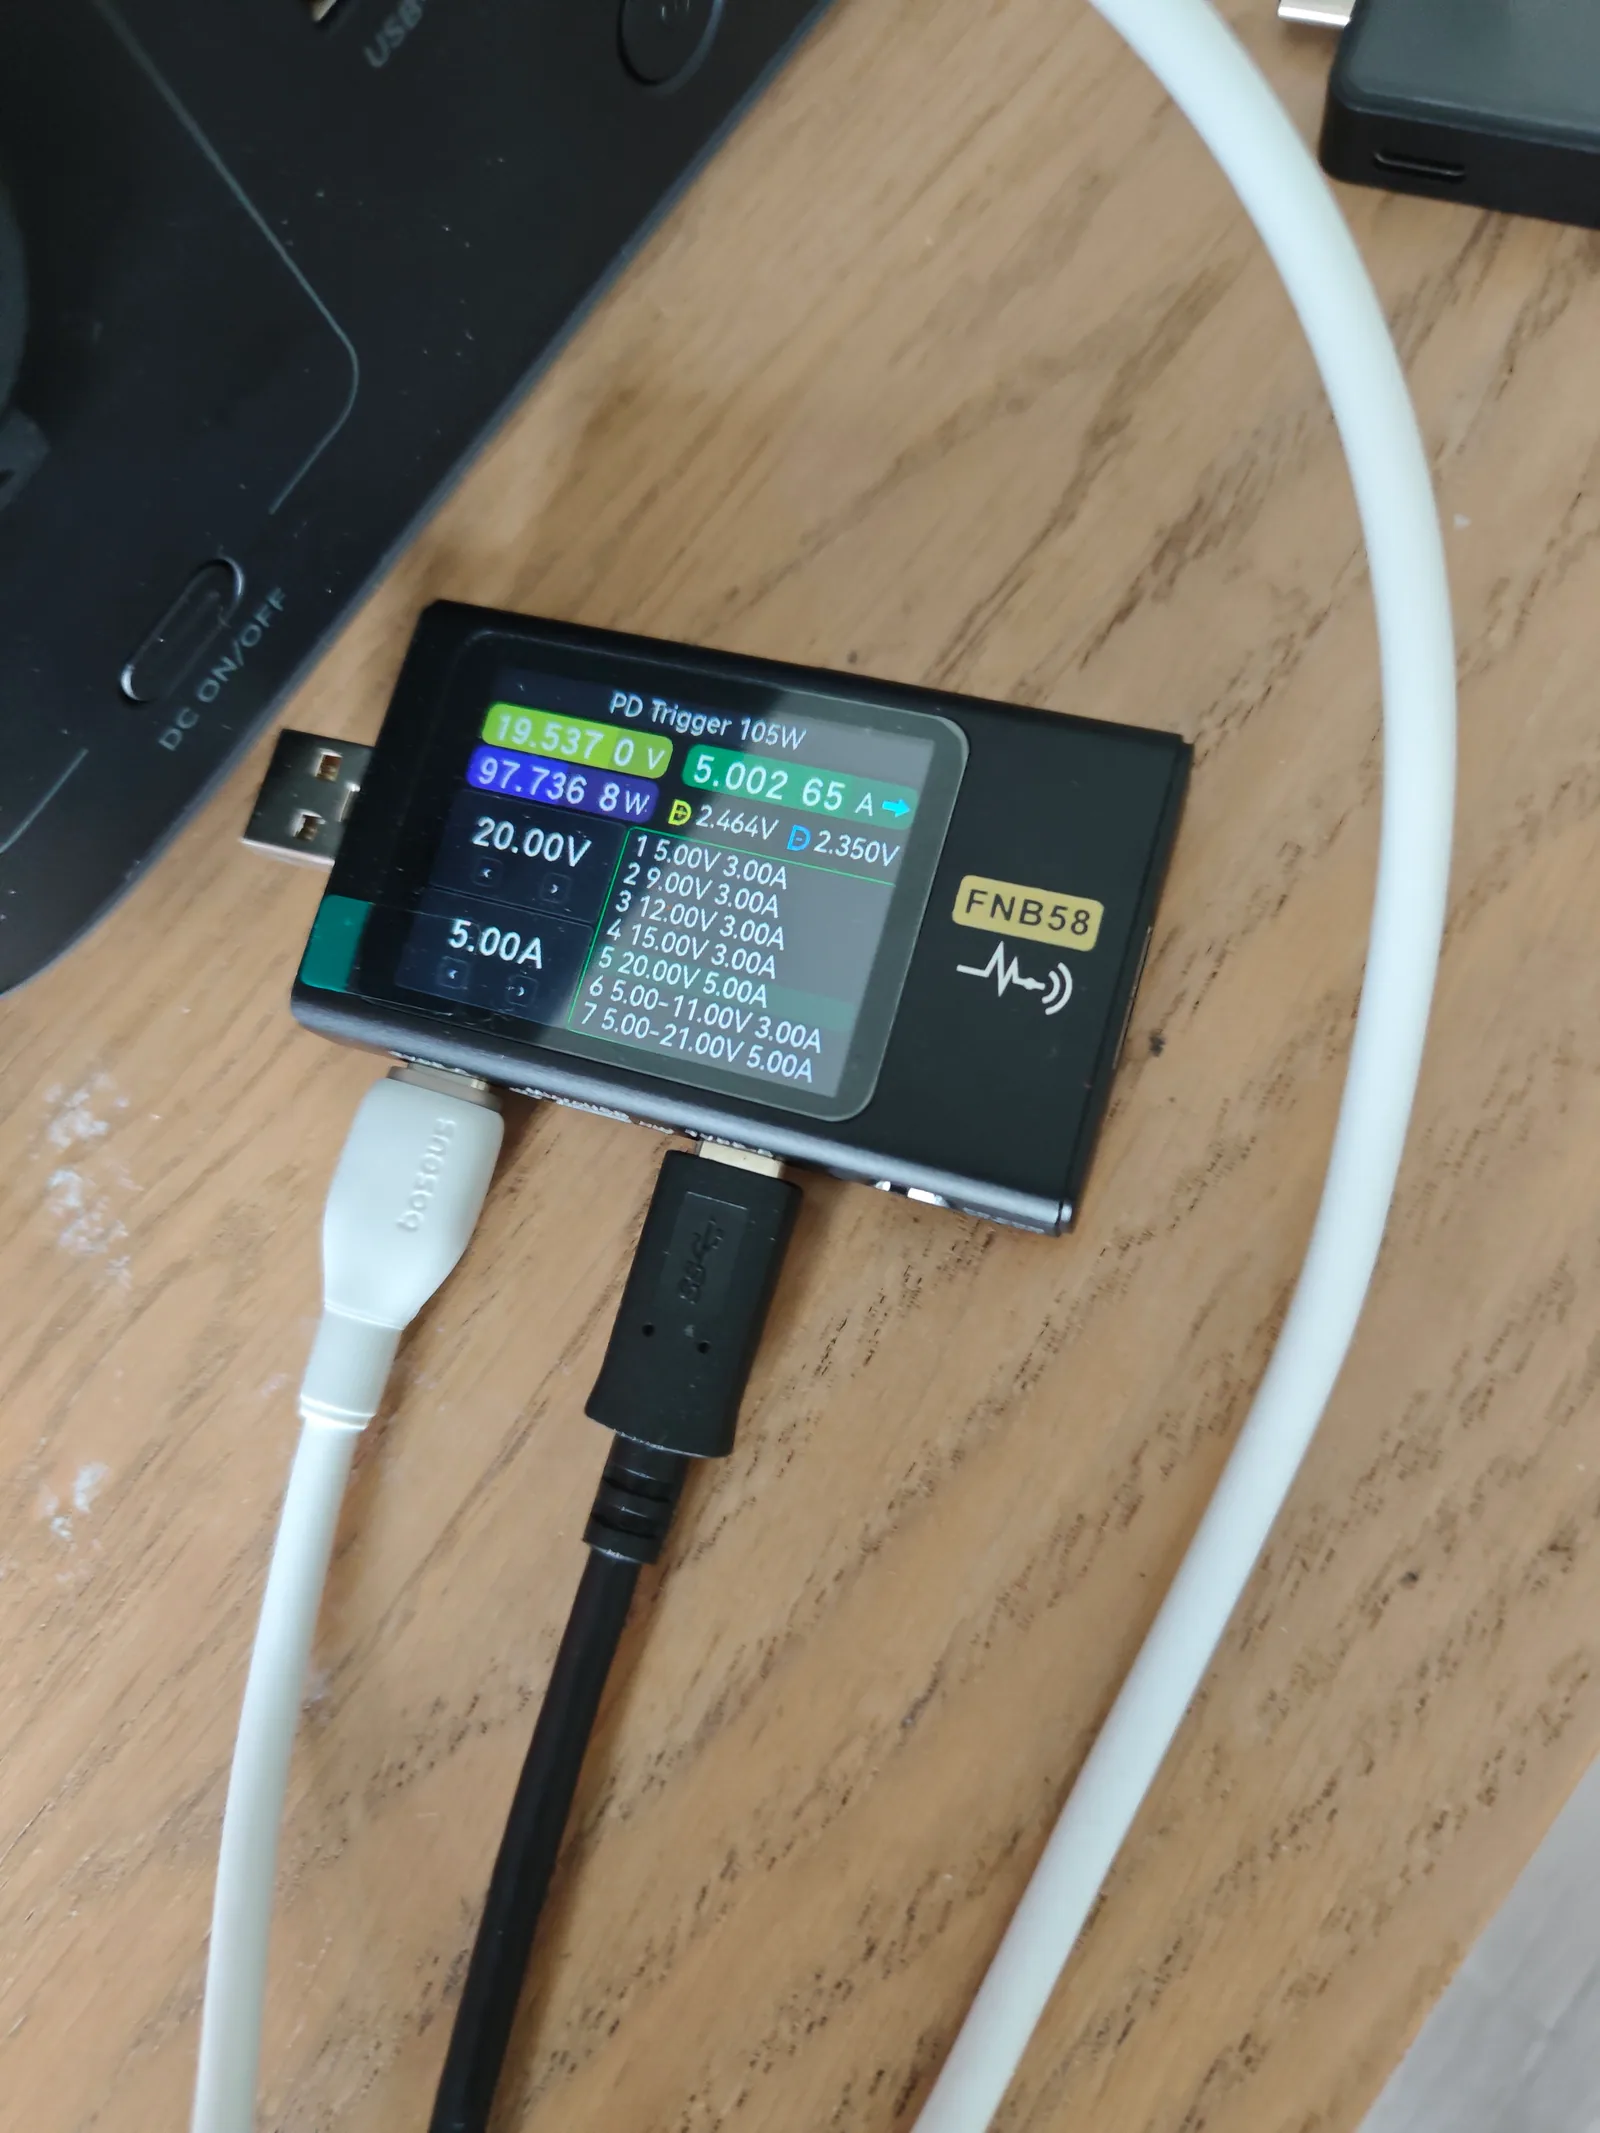
The full USB-C discharge ran for about 135 minutes at roughly 96W on the electronic-load side.
Heat and noise
The 100W-class 15-minute check was thermally uneventful. During that stage, the highest temperature we recorded was 36.1°C at the EcoFlow-side USB-C plug. The USB panel stayed around 30.3°C to 32.9°C, and the FNB58 shell/connector was around 33.5°C to 35.3°C where measured.
During the longer full USB-C discharge, the highest recorded temperature was 42.3°C at the USB panel. The fan ran throughout that discharge. We did not record abnormal heat, smell, softening cable insulation, or connector discoloration.
Noise at 50cm during the 100W-class check was 38.2dB, against a room background of 36.9dB. In a quiet room you may hear the fan, but it was not the loudest behavior we observed from this unit; fast AC charging was more obvious — we logged its full noise curve in the RIVER 3 charging test.
The cable lesson: 60W may be a cable problem, not a power-station problem
One cable exposed only 20V/3A. That capped the practical result at about 60W:
20V × 3A = 60WAfter changing to a cable that the meter recognized as 5A-capable, the same power station exposed 20V/5A and passed the 100W-class test.
If your RIVER 3 only charges a laptop around 45W to 60W, check these before assuming the station is defective — we turned every slow-USB-C symptom we hit into a step-by-step EcoFlow USB-C slow-charging diagnosis, including the 5V fallback case:
- The USB-C cable must support 5A, usually with an E-Marker chip.
- The device must actually request more than 60W.
- The battery level and thermal state of the laptop can limit charging.
- Some USB-C testers or trigger boards can change PD behavior when downstream cables are connected.
In our troubleshooting, connecting one downstream cable made the FNB58 pop a PD trigger confirmation screen or fall back to 5V. The connector was not pressing a button. The issue appeared when the downstream cable was added, even before the electronic load was turned on. We treated that as a test-chain behavior, not as evidence that the RIVER 3 lacked 100W capability.
What this means for laptop users
For a 13-inch or 14-inch laptop that normally charges at 45W to 65W, the RIVER 3’s USB-C port should have plenty of headroom. For a machine that can pull close to 100W, our result suggests the port is capable, but you need the right cable and the laptop has to request the higher profile.
The 216.8Wh estimate also gives a more realistic planning number than the nameplate capacity alone. If your laptop averages 40W while working, a rough expectation from USB-C is:
216.8Wh ÷ 40W ≈ 5.4 hoursAt 60W average, the rough number becomes:
216.8Wh ÷ 60W ≈ 3.6 hoursReal laptop runtime can be lower or higher because screens, CPU load, battery charging state, and sleep behavior change constantly. Still, the USB-C output result is strong for a compact 245Wh-class station.
Bottom line
The EcoFlow RIVER 3’s USB-C port passed our 100W-class testing. With a verified 5A cable, it exposed 20V/5A, held about 97.6W at the meter for 15 minutes, ran a full 100W-class discharge for about 135 minutes, and delivered an estimated 216.8Wh.
The biggest practical warning is cable selection. A normal-looking USB-C cable can silently limit the setup to 60W. If you are buying the RIVER 3 mainly for laptops, include a known-good 5A USB-C cable in the plan.